
The average Brighton & Hove home was £412,316 in September, up 0.8% in a month as the South East fell. It is still £4,401 below a year ago.
The average Brighton & Hove home was worth £412,316 in September, up 0.8 per cent in a single month. That rise came while prices across the South East fell 0.3 per cent and England’s fell 0.4 per cent. The figures are from the UK House Price Index for September 2026, published by HM Land Registry and the ONS on 18 November.
The city is still behind where it was a year ago. September 2025’s average was £416,717, so prices are down £4,401, or 1.1 per cent, on the year. UKHPI is a mean average, not a median, so a handful of very expensive sales can move it.
Highest since last October
September’s figure is the highest the city average has been since October 2025, when it stood at £417,253. The low point came in March 2026, at £400,663. Since then the average has risen £11,653.
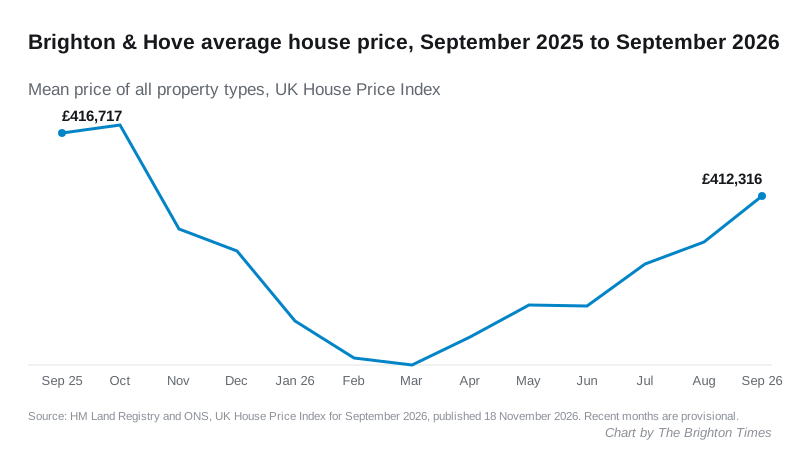
The month by month path since the low:
- March 2026: £400,663, the bottom
- April: £402,620, up 0.5%
- May: £404,779, up 0.5%
- June: £404,720, a £59 dip
- July: £407,658, up 0.7%
- August: £409,186, up 0.4%
- September: £412,316, up 0.8%
Every type of house is up on the year. Flats are not
| Property type | September 2026 average | Change on the year |
|---|---|---|
| Detached | £864,881 | +0.4% |
| Semi-detached | £554,792 | +0.7% |
| Terraced | £480,511 | +0.2% |
| Flat or maisonette | £297,793 | -2.8% |
Flats are the reason the city’s annual figure is still negative. They are a large share of what sells in Brighton and Hove, and they are 2.8 per cent cheaper than a year ago.
The average Brighton or Hove flat now costs £554 more than the average home of any type in Worthing, which was £297,239 in September. On the latest revised figures, the flat was below the Worthing average in both July and August.
How the neighbours did in September
| Area | Average price | Change in a month | Change in a year |
|---|---|---|---|
| Mid Sussex | £439,349 | +1.3% | -0.3% |
| Brighton & Hove | £412,316 | +0.8% | -1.1% |
| South East | £378,915 | -0.3% | -0.2% |
| Adur | £375,922 | 0.0% | -1.1% |
| Lewes district | £374,607 | -0.1% | +1.2% |
| Worthing | £297,239 | -0.1% | -3.0% |
| England | £292,998 | -0.4% | +0.8% |
Only Mid Sussex, the commuter district over the Downs, rose faster in the month. Lewes district is still the only close neighbour where prices are higher than a year ago.
What it means for you
If you are selling a house, the last six months have been steady: five monthly rises and one £59 dip since March. Semis are up 0.7 per cent on the year.
If you are buying your first home, the first-time buyer average was £346,406 in September, down 1.4 per cent on a year earlier. Home movers paid an average of £503,859, down 0.6 per cent. The average house price in Brighton, by type and against Sussex, is on our house prices page.
The figures will move
These are provisional figures, and the Land Registry revises them as late sales are registered. August was first published as £408,240, down 2.1 per cent. It now reads £409,186, down 1.9 per cent. July has been revised the other way, from £408,948 to £407,658.
Sources
- HM Land Registry and ONS: UK House Price Index for September 2026, published 18 November 2026, and the full data file for Brighton and Hove (E06000043), Adur, Lewes, Mid Sussex, Worthing, the South East and England
- ONS: Housing prices in Brighton and Hove
Have your say