

The average Brighton & Hove home sold for £408,240 in August 2026, down 2.1% on the year. Flats fell 3.9%; prices by type, by area and against Sussex.
The average home in Brighton & Hove sold for £408,240 in August 2026, down 2.1% on a year earlier. Asking prices in agents’ windows tell you what sellers hope for; the figures on this page are what homes actually changed hands for, recorded by HM Land Registry once each sale completes and published as the UK House Price Index on 21 October 2026. The city is lagging both its region and the country: the South East fell 0.8% over the same twelve months and England rose 0.4%. Here is the full picture, each figure linked to its source.
The headline figure
The £408,240 city average for August 2026 is the provisional figure from the official UK House Price Index, built from completed Land Registry sales across the whole of Brighton & Hove: Brighton, Hove, Portslade, Rottingdean, Saltdean and everywhere between.
Three things stand out in the latest data:
- Prices fell 2.1% over the twelve months to August 2026, about £8,700 on the average home (£416,969 in August 2025). The brief recovery reported in the summer has been revised away: June was first published as a 0.3% rise and now reads as a 0.4% fall.
- The city is doing worse than its region. The South East’s average fell 0.8%, to £379,953, while England’s rose 0.4% to £293,525. Brighton & Hove still costs more than both, about £28,000 above the regional average.
- Flats are doing most of the falling. Brighton’s market is a flat market more than most cities’, and flats are down 3.9% on the year. Every type of home is lower than a year ago, but houses only slightly.
One caveat worth carrying: UKHPI figures are provisional and get revised as late-registered sales arrive, so treat the precise pounds as an estimate that will settle over the next few months.
What you pay by property type
These are the August 2026 averages from the UK House Price Index for Brighton and Hove, with the change over the year:
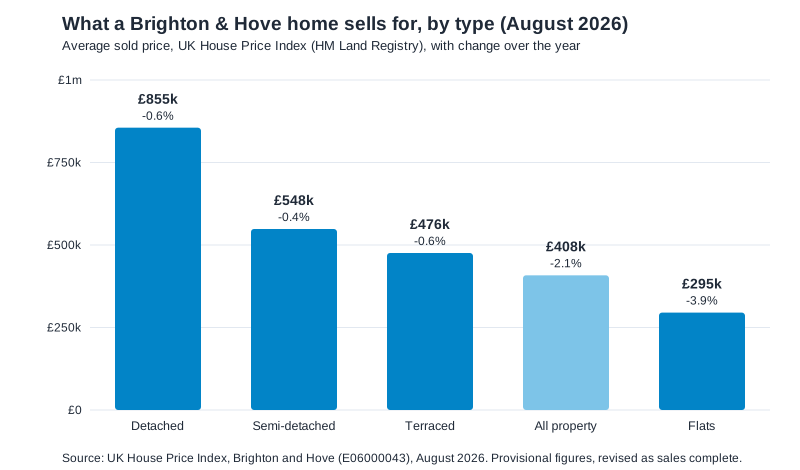
- Detached houses: £855,390, down 0.6% on the year. Rare in the city itself, these cluster in Withdean, Woodingdean, Ovingdean and the older roads of Hove.
- Semi-detached houses: £548,417, down 0.4%, the most resilient type of home in the city.
- Terraced houses: £475,621, down 0.6%. The classic Brighton home, from Hanover’s coloured cottages to the long streets off Lewes Road.
- Flats and maisonettes: £295,136, down 3.9%, the weakest corner of the market by a distance. Flat buyers are the most exposed to mortgage costs and, in Brighton, to rising service charges and leasehold caution, and it shows.
A first-time buyer in Brighton & Hove paid an average of £343,329 in August 2026, down 2.3% on a year earlier. A home mover, someone selling one home to buy another, paid £498,706. The £155,000 gap between those figures is the size of the step from a first flat to a family house in this city.
Hove, Portslade and the villages
The city average hides a wide spread. Rightmove’s sold-price records put the last year’s averages by area as follows; these are listing-area figures built from a smaller number of sales than the city-wide index, so treat them as a guide to the pecking order rather than gospel:
- Hove: £538,607, about 1% down on the previous year. The premium over Brighton reflects Hove’s stock: wide Victorian terraces and semis rather than one-bed flats.
- Rottingdean: £703,736, up sharply on the year, though the village’s small number of sales makes its average jumpy (Rightmove).
- Portslade: £392,875, the most affordable of the three, and the closest thing the city has to a value route into a house with a garden (Rightmove).
The rule of thumb: seafront squares and the conservation streets of Hove and Kemptown carry the premiums, while Portslade, Moulsecoomb and Whitehawk offer the lower rungs of the ladder.
How Brighton & Hove compares to its neighbours
| Area | Average price | Change in a year |
|---|---|---|
| Brighton & Hove | £408,240 | -2.1% |
| Mid Sussex | £431,904 | -0.8% |
| Adur | £378,990 | 0.0% |
| Lewes district | £374,305 | +1.5% |
| South East region | £379,953 | -0.8% |
| England | £293,525 | +0.4% |
Brighton & Hove is falling faster than any of its neighbours: Mid Sussex, the commuter district over the Downs, fell 0.8% and still averages more than the city, while Adur held level and Lewes district rose 1.5%. Part of that is the flat effect: the neighbouring districts sell far more houses than flats, so the type of home doing worst nationally weighs less on their averages. If you are selling a house in Brighton or Hove, the market for your home is steadier than the headline suggests; if you are selling a flat, price realistically from the start.
What it means for you
If you are buying, flats are the softest part of the market, nearly 4% cheaper than a year ago; check the council tax band of anything you view, since that bill runs from £1,720 to £5,159 a year in this city. If you are selling a house, semis and terraces are down less than 1% on the year and well-priced terraces still move. If you are staying put, a house has broadly held its value while a flat has lost ground, and the fast trains to London that underpin Brighton commuter demand are not getting slower.
For the month-by-month picture and how Brighton compares with the rest of Sussex, see our reports on the June 2026 and July 2026 releases.
Frequently asked questions
What is the average house price in Brighton?
£408,240 in August 2026 across Brighton & Hove, per the UK House Price Index, which is built from completed Land Registry sales. Houses average far more: £475,621 for a terrace, £548,417 for a semi.
Are Brighton house prices falling?
Yes. The city average fell 2.1% in the year to August 2026, and a rise first reported for June has since been revised into a fall. Flats fell hardest, by 3.9%; semi-detached and terraced houses are down less than 1%.
Why are flats in Brighton cheaper than houses by so much?
The average flat sold for £295,136 against £475,621 for a terraced house. Flats are the first rung of the ladder, the most mortgage-sensitive purchase, and Brighton has a very large supply of converted and purpose-built flats, so soft demand shows up there first.
Is Hove more expensive than Brighton?
On sold prices over the last year, Hove averaged £538,607 (Rightmove), well above the city-wide £408,240, reflecting its larger stock of houses rather than a like-for-like premium on identical homes.
Sources
- UK House Price Index, Brighton and Hove (E06000043), August 2026 provisional figures published on 21 October 2026 (HM Land Registry / ONS), including property types and buyer status, plus the same series for Lewes, Adur, Mid Sussex, the South East and England
- Rightmove sold-price areas for Hove, Rottingdean and Portslade (last-year listing-area averages)
Figures are provisional and revised as late sales register: the June 2026 city average was first published as £407,803, up 0.3%, and now reads £404,798, down 0.4%. Checked against the sources above on 25 October 2026.
Have your say