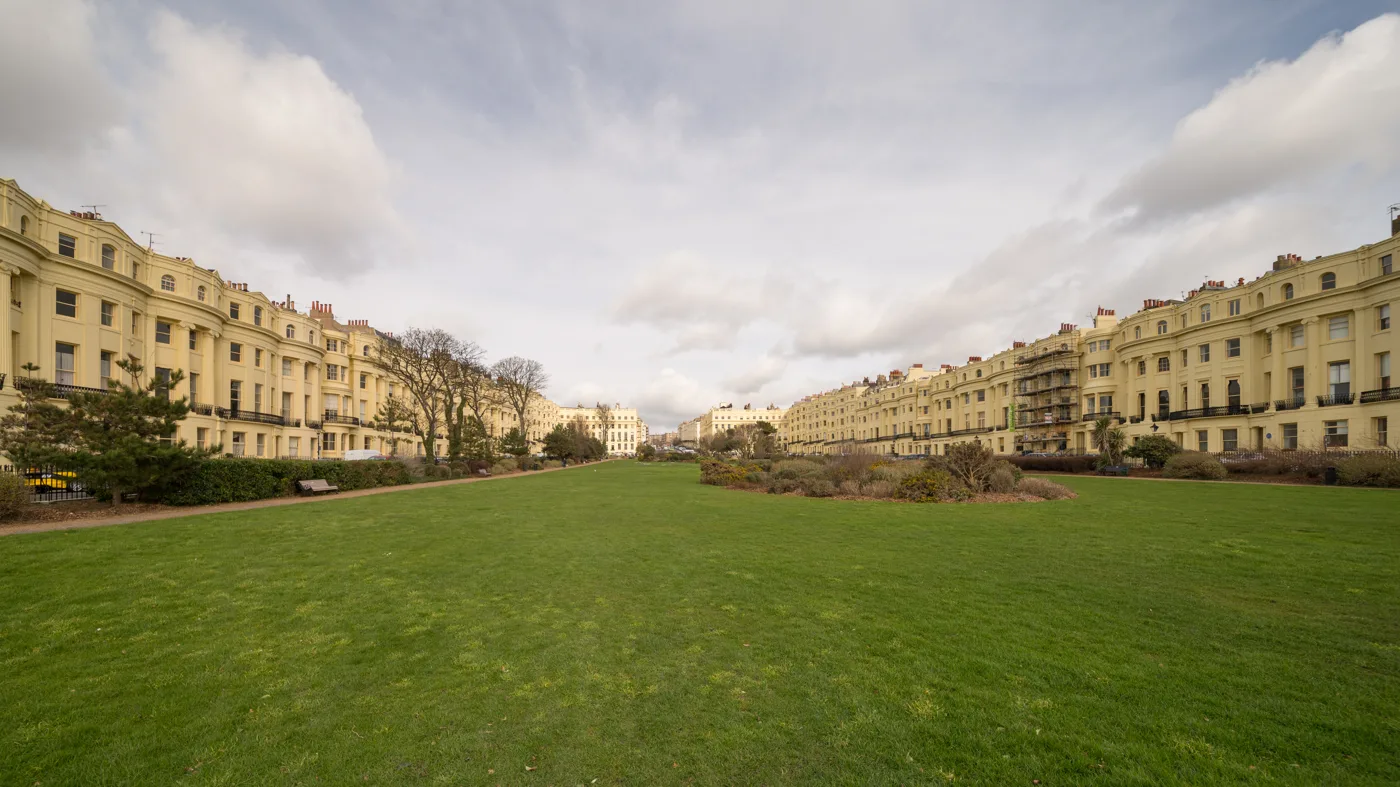

The average Brighton & Hove home was £408,948 in July, £4,603 less than a year earlier. Flats fell 3.1% and now cost less than the average Worthing home.
The average Brighton & Hove home was worth £408,948 in July, £4,603 less than a year earlier. The annual change of minus 1.1 per cent looks like a lurch after June’s small rise, but the fall it records happened last autumn, not this summer. The figures are from the UK House Price Index for July 2026, published by HM Land Registry and the ONS on 17 September. UKHPI is a mean average, not a median, so a handful of very expensive sales can pull it around.
Prices actually rose 0.3 per cent between June and July. The average is now £7,111 above February’s low. The annual figure turned negative for a different reason: July 2025 was near the top of the market, so this July is being compared against a high point.
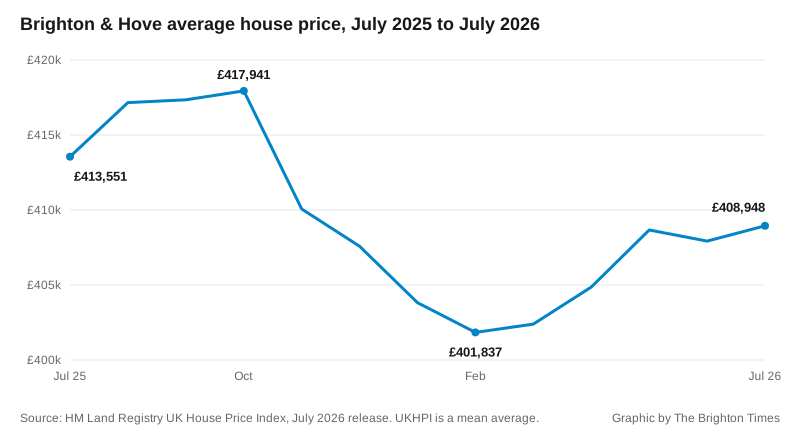
The shape of the year is all there in the chart:
- July 2025: £413,551. The market was still climbing.
- October 2025: £417,941. The peak.
- February 2026: £401,837. The bottom, £16,104 below the peak.
- July 2026: £408,948. Five months of slow recovery, still £4,603 short of a year ago.
Houses are rising, flats are still falling
The city average hides two different markets. Every type of house rose over the year. Flats, which make up a large share of what actually sells in Brighton, fell 3.1 per cent.
| Property type | July 2026 average | Change on the year |
|---|---|---|
| Detached | £858,475 | +0.3% |
| Semi-detached | £549,795 | +0.8% |
| Terraced | £475,728 | +0.4% |
| Flat or maisonette | £295,683 | -3.1% |
When the June figures were first published a month ago, the average Brighton or Hove flat and the average Worthing home of any type were worth the same to the pound. In July the flat sits behind: £295,683 for a Brighton or Hove flat, against £297,200 for the average home in Worthing, ten miles along the coast.
The neighbours
Across the Sussex coast in July, on the same release:
- Adur (Shoreham and Southwick): £380,120, up 1.3% on the year
- Lewes district: £368,408, up 0.8%
- Brighton & Hove: £408,948, down 1.1%
- Worthing: £297,200, down 3.9%
The pattern from the June release holds: the districts either side of the city are rising gently, while Brighton & Hove and Worthing are the two still below where they stood a year ago.
What it means for you
If you are selling a house, the market is quietly firmer than the headline suggests: semis are up 0.8 per cent on the year and the citywide average has risen every month since February except June’s 0.2 per cent dip.
If you are buying your first home, the figure that matters is not the £408,948 average. The first-time buyer average is £343,929, down 1.3 per cent on the year, and the flat average of £295,683 is down again on June’s revised £295,790. The Brighton house prices page explains the index, council tax implications sit on the council tax bands page, and sold prices for individual streets are in the Land Registry’s price paid data.
One caution on precision: the Land Registry revises each month as more sales are registered. June’s average was first published as £407,803 and now reads £407,924, a £121 revision. Sales counts lag further still; the most recent month with a published count is May 2026, at 196 sales.
Sources
- HM Land Registry and ONS: UK House Price Index, Brighton and Hove, July 2025 to July 2026, published 17 September 2026, and the same index for Adur, Lewes and Worthing
Have your say