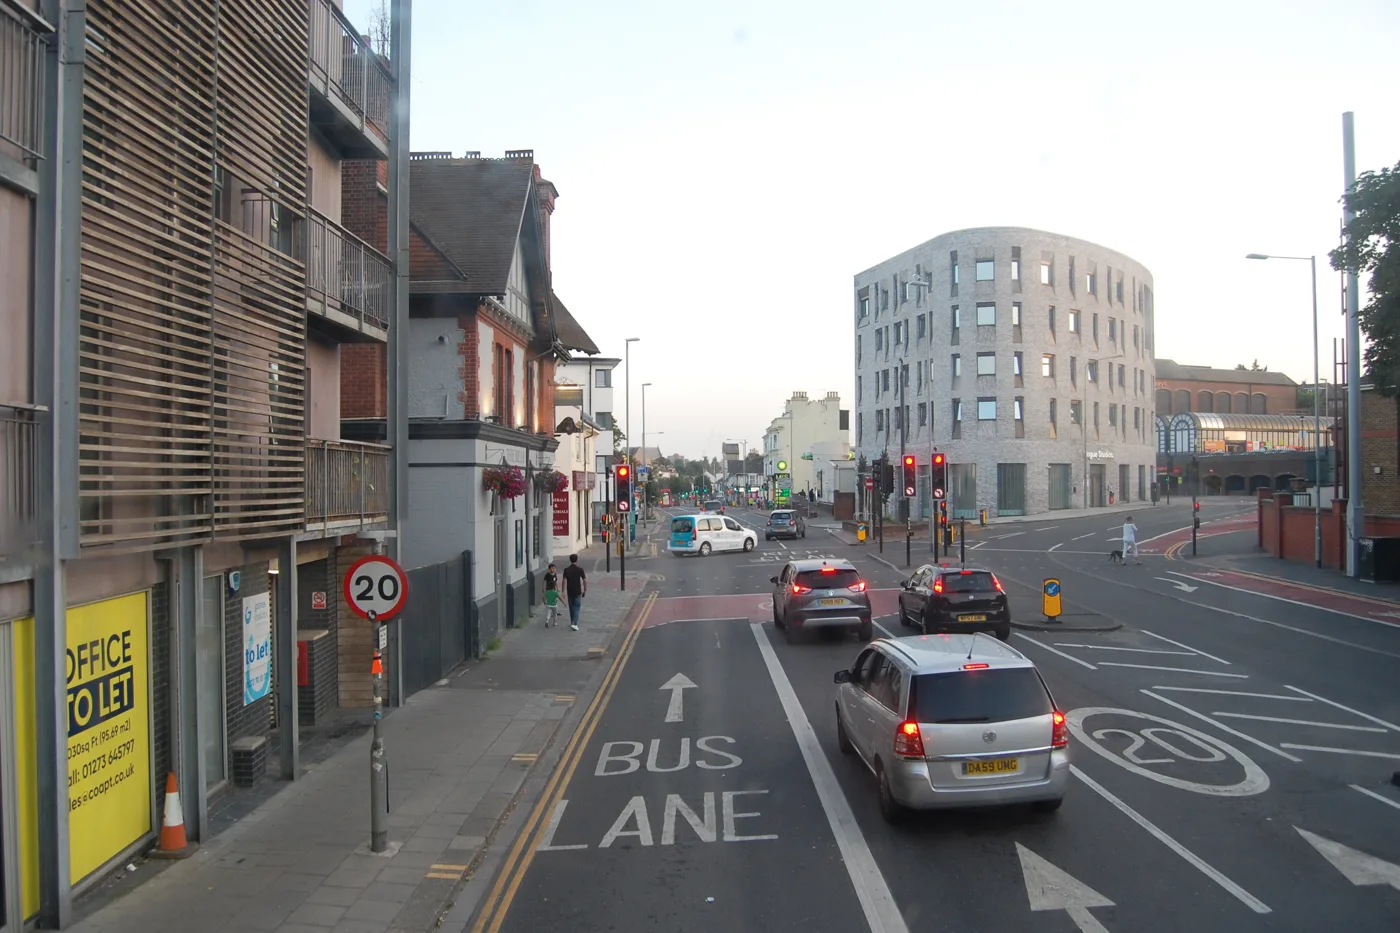

London Road recorded Brighton's highest nitrogen dioxide in 2025 at 33.2, inside the legal limit of 40. Three streets still miss the council's own target.
Every home where Brighton & Hove City Council measures nitrogen dioxide met the legal limit in 2025. The council says it is the first year that has happened. Three streets are still above the target the council set itself.
The figures are in the council’s 2026 Air Quality Annual Status Report, which carries the verified results for 2025. The report is dated June 2026. The council published its data tables in September.
The dirtiest streets
Nitrogen dioxide, or NO2, comes mainly from engines and boilers. The UK legal limit is an annual average of 40 micrograms per cubic metre of air. The council’s own Air Quality Action Plan target is 30.
The highest reading in 2025 was 33.2, on Oxford Street beside London Road. These are the ten highest areas in the council’s league table:
| Area | Road | NO2 in 2025 |
|---|---|---|
| London Road and Oxford Street | A23 | 33.2 |
| Lewes Road | A270 | 32.2 |
| North Street | B2066 | 31.5 |
| Edward Street and Pavilion Parade | 29.9 | |
| New England Road | A23 | 29.3 |
| Grand Parade | A23 | 29.3 |
| Viaduct Road | A23 | 28.4 |
| The Drove and South Road | 28.1 | |
| Terminus Road | A2010 | 27.9 |
| Queens Road | A2010 | 27.8 |
All figures are annual averages in micrograms per cubic metre. The Lewes Road and Terminus Road monitors captured less data than the rest, at 75% and 68.7% of the year.
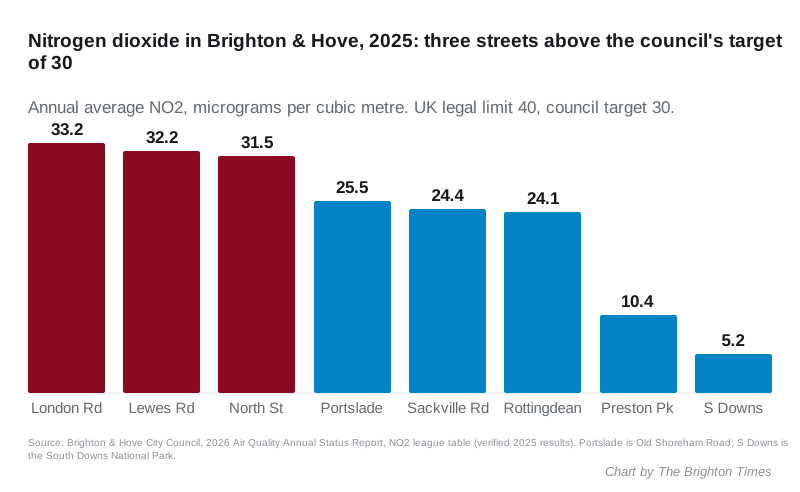
Only the top three are above the council’s target of 30. All three are in the area the council calls AQMA1, one of its six air quality management areas.
The report says all monitored homes and similar locations were below 36. It says that gives “reasonable confidence” the legal limit of 40 was achieved.
Outside the centre
Readings fall quickly away from the main bus and traffic corridors:
- Old Shoreham Road, Portslade: 25.5
- South Portslade, on the A259: 24.6
- Sackville Road north, Hove: 24.4
- Rottingdean, on the B2123: 24.1
- Royal Sussex County Hospital: 19.5
- Preston Park: 10.4
- Rottingdean beach: 10.0
The cleanest air the council measures is in the South Downs National Park, at 5.2. London Road’s reading is 6.4 times that level.
The report says the Rottingdean seafront monitor met the World Health Organization guideline of 10 for the first time.
Why North Street is different
North Street is mostly used by buses and taxis. It sits inside the city’s bus-based ultra-low emission zone. Its reading at the building line was 31.5, but the report says 40 was detected at the kerbside.
The council says electric buses will bring that down. Zero-emission buses funded through the government’s ZEBRA scheme and Brighton & Hove Buses are being introduced in 2026 and 2027 on routes that use the zone.
On Lewes Road, the report points to traffic queues on the approach to the Elm Grove and Vogue Gyratory junctions. It says lorry numbers south of the gyratory have fallen since 2019.
Fine particles went up
The second pollutant that matters is PM2.5, the fine particles produced by burning and by tyre and brake wear. The city met the current English requirement in 2025. The report says established urban monitors recorded “a small increase” on 2024.
The annual average is typically 7 to 10 micrograms per cubic metre in the urban area. In the South Downs National Park it is 3 to 6.
Levels were higher in central areas on some evenings and weekends between 13 December and 6 March. The report says domestic solid-fuel burning is “a recognised source”. It also says the monitoring does not, by itself, identify how much any one source contributes.
The advert the council had to withdraw
That caveat has a history, and the report sets it out. The council ran a campaign called “Cosy Killer” over two heating seasons, about particle pollution from burning solid fuel at home.
The report says the Advertising Standards Authority upheld a complaint about one advertisement in June 2026. According to the council’s account, the regulator found that the advert implied wood burners and open fires were the direct cause of a seasonal rise in PM2.5 at or next to four local schools. It concluded the evidence did not substantiate that claim.
The council says the advert “must not appear again in that form”. It says future communications will “distinguish measured concentrations from source attribution”.
What happens next
The council lists its priorities for the coming year:
- progress a single Smoke Control Area covering the city’s urban area
- continue bringing in zero-emission buses
- review all six air quality management areas before the current action plan expires in November 2027
- keep working towards its local NO2 and PM2.5 targets
The report also uses the European Union’s 2030 limit of 20 as a longer-term benchmark. It stresses that this is not a UK legal standard. Every roadside site in the league table except the County Hospital is above 20 today.
What it means for you
If you live, work or wait for a bus on London Road, Lewes Road or North Street, you are on the three most polluted streets the council measures. The air at the building line is within the legal limit. It is not yet as clean as the council says it should be.
If you have a wood burner or open fire, a citywide Smoke Control Area is coming. In a smoke control area you can only burn authorised fuels, or use an appliance approved by Defra (GOV.UK, smoke control area rules). The council has not published a start date in this report.
If you have asthma or a heart or lung condition, the report found fine particles were higher in the centre on some winter evenings and weekends.
The Western Road rebuild has moved 16 bus routes onto Montpelier Road, Davigdor Road and Holland Road until 6 November. Our Brighton roadworks and travel page has the diversions. The report notes that a 2023 bus diversion from Western Road was tracked with traffic counters and diffusion tubes.
Sources
- Brighton & Hove City Council: 2026 Air Quality Annual Status Report, including the NO2 league table
- GOV.UK: smoke control area rules
- Brighton & Hove City Council: PDF version and data tables for the 2026 report
Have your say